- Fault finding and fixing
There are a number of well-known misconceptions held by students of mathematics, many of which persist undetected into the college years. These misconceptions need to be identified and remedied to avoid major conceptual problems later. Many of the examples make use of common misconceptions, and so the task can play a diagnostic role.
The tasks in this package offer students a number of mathematical mistakes which they are asked to diagnose and rectify. These require students to analyze mathematical statements and deduce from the context the part that is most likely to contain the error (there may be more than one possibility), explain the cause of the error and rectify it. Such tasks can be quite demanding. It is often more difficult to explain the cause of another's seductive error than to avoid making it oneself. Contexts include percentages, graphical interpretation, and reasoning from statistical data (download tasks).
Example: Double Coin Toss
- I'll toss two coins.
- If they both come up heads then Jane wins.
- If they both come up tails then Ben wins.
- If we get one head and one tail then I win.
Explain why this is not a fair game.
(Answer.)
- Plausible estimation (Fermi problems)
Plausible Estimation consists of a one or two easily-stated questions which at first glance seem impossible to answer without reference material, but which can be reasonably estimated by following a series of simple steps that use only common sense and numbers that are generally known or are amenable to estimation.
Plausible Estimation tasks involves students in an activity central to modelling in science, other areas of intellectual activity, and in everyday life. The core skill is to create (or check) estimates of quantities that, at first glance, seem unknowable. Students are also required to communicate their assumptions and results and check the plausibility of their answers. In addition, Plausible Estimation requires students to practice arithmetic fluency, ability to handle large numbers, and conversion of units (download tasks).
Example: How many babies are born in the United States each minute?
(Answer.)
- Creating measures
Creating Measures consists of a series of questions that prompt students to evaluate an existing measure of an intuitive concept , and then create and evaluate their measure of this concept.
We constantly "mathematize," or construct measures for, physical and social phenomena and use these models to make decisions about our everyday lives. These can vary from measures of simple quantities (such as "speed" or "steepness") to complex and subjective social ones (such as "quality of life" or "best universities"). Since these measures are mathematical models of some phenomenon, they are open to criticism and improvement, especially when considering their usefulness. These tasks provide a fun and interesting way to assess your students' abilities to "mathematize" concepts and show students that there can be many different formal, quantitative measures of such concepts. More importantly, they emphasize that measures differ in their utility; some are more useful than others in representing concepts (download tasks).
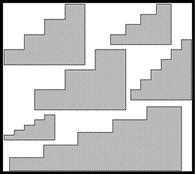
Example: Steepness

Without measuring anything, put the above staircases in order of steep-ness.
- Convincing and proving
This CAT introduces the notions of convincing and proving and illustrates several kinds of proofs commonly encountered in mathematics. These tasks are intended to assess how well students are able to argue logically, use examples and counterexamples to support their reasoning and identify breakdowns in rational argument. In addition, some tasks reveal common student misconceptions students make in their reasoning (download tasks).
There are two types of tasks:
- Evaluate a set of statements as "always, sometimes or never true". Students are expected to offer examples, counterexamples, and reasons for their decisions.
- Evaluate "proofs" and distinguish the correct from the flawed.
Example: If two rectangles have the same perimeter, they have the same area.
Is this always, sometimes or never true?
(Answer.)
- Reasoning from evidence
This CAT requires students to analyze unsorted data. The tasks will assess students' abilities to organize information, represent it in a meaningful way, and draw sensible conclusions. It is an important skill especially for students in a SMET discipline, to be able to analyze and interpret data, and argue critically and make informed decisions based on sound reasoning obtained from this data (download tasks).
Example: In this example, you are a Road Safety Advisor.
Your task is to produce some suggestions about how road safety in Smallville might be improved.
To help you, below you have a map of Smallville and a database of traffic accidents that took place during the last year. These figures show the time and place of the accident, details of the victim and the type of vehicle that caused the accident. (Times are given as decimals, to make graphing easier).
Your task is to:
- Find the trouble spots in the town.
- Try to decide why they are trouble spots.
- You have $100,000 to spend on improving road safety.
Tell me more about this technique:
Mathematical Thinking CATs || Fault Finding and Fixing || Plausible Estimation
Creating Measures || Convincing and Proving ||
Reasoning from Evidence

