Suggestions for Use
Adopt already-developed, field-tested instruments
Well-established conceptual diagnostic tests (such as the Force Concept Inventory in physics) are: research-grounded, normed with thousands of students at diverse institutions, the product of many hours of interviews to validate distractors, and subjected to intense peer review. Individual faculty are unlikely to match such efforts. You can adopt a test, but you must follow the guidelines for its use for the results to be valid and reliable. Generally that means that you give the assessment as a pre- and post-test, secure the tests, give enough time so that all students can complete all questions, state that it is a diagnostic test and has no effect on grades, and give all items in the order presented on the instrument.
Adopt already-developed test items
You may not wish to give a complete instrument for your classroom assessment. Instead, you can give selected items from a well-developed instrument (Figure 1). While you cannot compare your results to those normed from the complete instrument, this limited use may better match your course goals.
|
As seen from your location, when is the Sun directly overhead at NOON (so that no shadows are cast)?
A. Every day.
B. On the day of the summer solstice.
C. On the day of the winter solstice.
D. At both of the equinoxes (spring and fall).
E. Never from the latitude of your location.
Figure 1. Sample item from the Astronomy Diagnostic Test (ADT) version 1 (Zeilik et al., 1998). The correct response is "E".
|
Develop your own conceptual diagnostic questions
The main advantage with this process is that you can match questions closely to your course goals. You can try out one or two questions at a time; this method will take very little class time and gives you the chance for immediate revision based on feedback from the class. Over a few semesters you can build up a bank of well-constructed items. However, you really need to investigate the research literature before you take this path.
Step-by-Step Instructions
- Based on your experience or course goals, and perhaps a consensus of your colleagues, make a list of the most important concepts in your course.
- Check the misconceptions literature in your discipline to see if the research has revealed any misconceptions related to your key concepts. (See "Theory and Research.")
- If you don't find any explicit research materials, reflect on your own experience as a student and instructor. I have found, for instance, that most of the concepts I've identified as "key", my students identify as "difficult"; focus then on these.
- If you find a diagnostic test already available in your discipline, request a copy. Compare the items to your course goals and key concepts. If the test as a whole aligns with these, use it! If not, examine specific items for applicability to your course.
- Follow the developers' protocol for giving the test exactly. Contact them if you have any questions!
- Write brief, multiple-choice questions, using standard guidelines for developing good items. Avoid technical jargon; use plain English. (If you do a good job, students may perceive these questions as "hard" or "tricky" because rote memorization will not ordinarily give the correct answer.)
- Interview a few students to debug your questions. You want students to choose the "wrong" responses for the "right" reasons--that is, a certain misconception or a poor line of reasoning that leads them astray. Alternatively, debug the questions with the whole class, as described in the next section.
- The best use of a diagnostic test is as a pre/post assessment. You do not have to wait until the end of the semester to give a post test; you can give it right after instruction on a coherent instructional unit. If possible, you should obtain a standard item analysis, so you can check for problems with the test as a whole or with individual items. (On most campuses, this analysis is provided by the computer center.)
- One way to quantify the pre/post gains is to calculate a gain index (Hake, 1998). This is the actual gain (in percentage) divided by the total possible gain (also in percentage). Hence, the gain index can range from zero (no gain) to 1 (greatest possible gain). This method of calculating the gains normalizes the index, so that you can compare gains of different groups and classes even if their pretest scores differ widely. (Note that it is also possible to get negative results!) The formula is
gain index = (%post - %pre)/(100 - %pre)
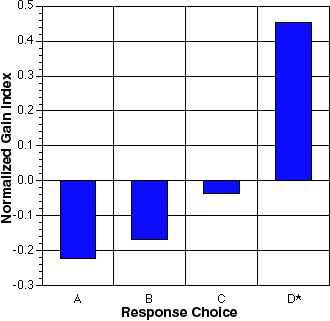
- You can do this gain calculation in two ways: (1) find the gain for the average pretest and average posttest score of the class as a whole (gain of the averages); or (2) average each student's gain (average of the gains). If your class size is greater than about 20 to 30, these two techniques will give essentially the same result. For the item in Figure 1, the pretest score (spring 1995) was 23%, the posttest score was 64%, so the gain of the averages was 0.53. You can also calculate the gain index for each response (Figure 2) and that way see how students changed their responses from pre to post. Why do this calculation? It gives you a "one-number" value so that you can compare classes over time (summative) or on-line (formative).

Figure 2. Gain results from a sample item from the Astronomy Diagnostic Test version 1 (Figure 1). Here we give the normalized gain index for each response. A negative value means that the response declined in choice; a positive value that it increased (E is the correct response). Data from four semesters at the University of New Mexico involving about 700 students.
Tell me more about this technique:

