 |
|||
|
|||||||||||||||||||||||||||||
|
|
|||||||||||||||||||||||||||||
|
|
Testing a New Deodorant, Example #1 (solution) || Emergency 911!, Example #2 (solution) Ordering a Cab, Example #3 (solution) || Traffic Accidents, Example #4 (solution)
Malcolm Swan
Jim Ridgway
Last week there was an accident at the Waterfront Amusement Park in Bay City. A seat on one of the rides broke loose resulting in the death of two teenagers. The owners of the amusement park have charged that if ambulances had responded more quickly, the two teens would have survived. They have threatened to sue the Bay City 911 emergency service for failing to dispatch ambulances efficiently.
 The Bay City Council has hired your firm to conduct an independent investigation of the City's 911 response. Upon completion of your investigation, you are to make a report to the City Council on your findings along with any recommendations for improving the 911 emergency service in the neighborhood of the amusement park. You start to work on this assignment. Your investigation has uncovered the following information.
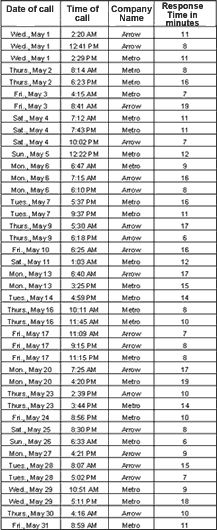
You need to continue your investigation by analyzing the response time data from the 911 log sheets for May. (The log sheets are shown on the next page). Based on the information above and your analysis of the response time data, you conclude that the Bay City Council needs to establish a policy about which service to call.
 Click on this image to open a new window with a larger version of this image.
Calculating mean response times for each ambulance service is a reasonable start to analyzing the data. However, the mean response time for Arrow Ambulance Service is 11.36 minutes. The mean response time for Metro Ambulances is 11.56 minutes. The difference of 0.2 minute is not significant and suggests some further investigation of the data is warranted.
A likely choice would be to select response time and time of call to see if there is a relationship between these variables. A scatter plot graphing the response times for given times at which the calls were placed is an appropriate graphical representation.
An analysis of the scatter plot suggests that Metro Ambulances tends to have a quicker response time during the a.m. hours and Arrow Ambulance Service tends to have a quicker response time during the p.m. hours. Given this further analysis, a reasonable policy recommendation would be to have 911 operators dispatch Metro Ambulances between the morning hours of 12 midnight until 12 noon and to dispatch Arrow Ambulance Service during the afternoon and evening hours of 12 noon until 12 midnight.
A more complete solution would take into account whether there might be other relationships that might affect a policy recommendation. Further analysis of the data could consider the relationship between response time and the day of the week in which a call is recorded. A scatterplot of these data are presented next.
An analysis of this scatterplot suggests that the day of the week in which a call is received by a 911 operator has no effect on the response time.
|
Search || Who We Are || Site Map || Meet the CL-1 Team || WebMaster || Copyright || Download
College Level One (CL-1) Home || Collaborative Learning || FLAG || Learning Through Technology || NISE