Go to Collaborative Learning Go to FLAG Home Go to Search
Go to Learning Through Technology Go to Site Map
Go to Who We Are
Go to College Level One Home
Go to Introduction Go to Assessment Primer Go to Matching CATs to Goals Go to Classroom Assessment Techniques Go To Tools Go to Resources


Go to Tools overview
Go to Tool search
Go to Tools sorted by discipline
Go to Tools sorted by technique


Tools - Math 'Reasoning from Evidence' Testing a New Deodorant, Example #1 (solution)


Testing a New Deodorant, Example #1 (solution) || Emergency 911!, Example #2 (solution)
Ordering a Cab, Example #3 (solution) || Traffic Accidents, Example #4 (solution)

Malcolm Swan
Mathematics Education
University of Nottingham
Malcolm.Swan@nottingham.ac.uk

Jim Ridgway
School of Education
University of Durham
Jim.Ridgway@durham.ac.uk


The aim of this assessment is to provide the opportunity for you to:
  • select appropriate methods to analyze a data set, including appropriate graphs and calculations
  • use data analysis to draw conclusions from the evidence obtained.

A scientist is testing a new deodorant before it goes into production. She has created two possible fragrances, A and B, and two possible names, 'Bouquet' and 'Hunter'. She conducts an experiment to see which combination of fragrance and packaging people prefer. 40 people are asked to smell a small amount of the deodorants, sprayed from 4 cans.
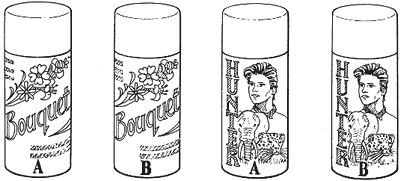

Picture of 4 cans of deodorants labeled Bouquet A, Bouquet B, Hunter A, and Hunter B.

They are not told that 'Bouquet A' and 'Hunter A' both contain exactly the same fragrance, A, or that 'Bouquet B' and 'Hunter B' both contain the same fragrance, B. Each person is asked to fill in a sheet, ticking a box to show how he or she feels about each of the four deodorants.
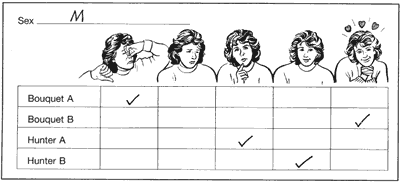
Picture of a completed score sheet.  There are 5 columns with pictures above each ranging from a woman holding her nose to a woman with hearts above her head.  There are 4 rows labeled: Bouquet A, Bouquet B, Hunter A, and Hunter B.
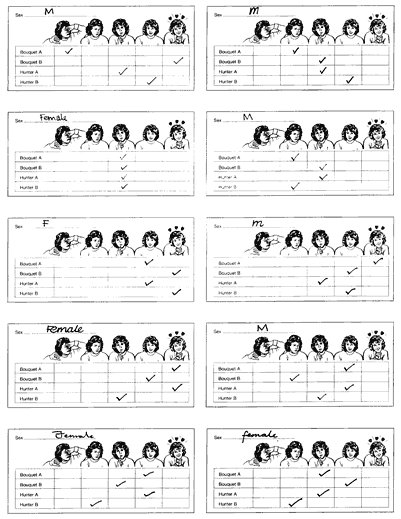
For example, this person is male. He hates Bouquet A, thinks Bouquet B is wonderful, that Hunter A is average and Hunter B is quite nice. The 40 results from the experiment are shown on pages 2 to 5.

Write a report saying which fragrance (A or B) and name (Hunter or Bouquet) are likely to be the most suitable if she wants to sell the deodorant to (i) females and (ii) males. Use tables and/or graphs in your report and make sure you explain in detail how you arrive at your conclusions.


Testing a new deodorant...Data Sheet 1
Picture of 10 completed score sheets; 5 completed by men and 5 by women.
Click on this image to open a new window with a larger version of this image.
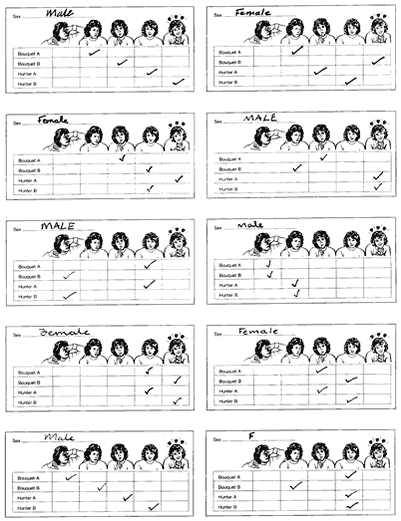

Testing a new deodorant...Data Sheet 2
Picture of 10 completed score sheets; 5 completed by men and 5 by women.
Click on this image to open a new window with a larger version of this image.
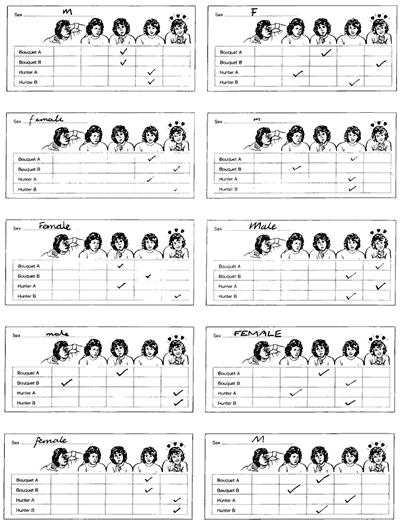

Testing a new deodorant...Data Sheet 3
Picture of 10 completed score sheets; 5 completed by men and 5 by women.
Click on this image to open a new window with a larger version of this image.
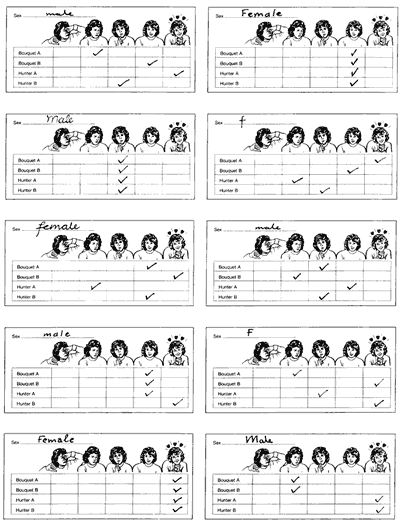

Testing a new deodorant...Data Sheet 4
Picture of 10 completed score sheets; 5 completed by men and 5 by women.
Click on this image to open a new window with a larger version of this image.


Testing a New Deodorant - Sample Solution

The following approach shows just one of the many ways the data may be analyzed. It should not be seen as prescriptive.

On the next page, we have drawn bar charts to show how many people gave each rating to each product. The pictorial ratings have been represented by the numbers -2, -1, 0, 1, 2 as shown below:

Picture of a score sheet with values of -2, -1, 0, 1, and 2 used for the pictures of women ranging from a woman holding her nose to a woman with hearts above her head.

This enables a mean rating to be calculated for each product, giving
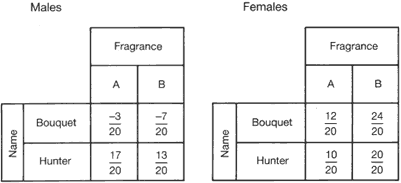
Summation of the testing data.  For men the scores were: Bouquet A: -3, Bouquet B: -7, Hunter A: 17, Hunter B: 13.  For women the scores were: Bouquet A: 12, Bouquet B: 24, Hunter A: 10, Hunter B: 20.

Thus it may be seen that the males seem to be more affected by the name than are the females, preferring 'Hunter'. There also appears to be a slight preference for fragrance A.

The females appear more able to distinguish the fragrance, preferring B, while there is also a slight preference for the name 'Bouquet'.
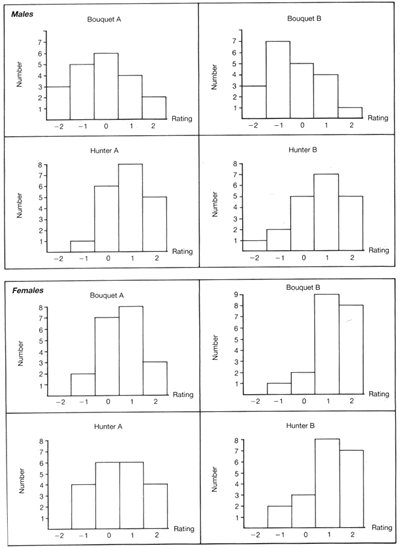
Summation of the testing data in bar graph form.  There are 2 sets of 4 bar graphs: one set for men and the other for women.  Each set contains a bar graph with the number individuals versus the scores of -2, -1, 0, 1, or 2 for each of the 4 choices: Bouquet A, Bouquet B, Hunter A, and Hunter B.


Testing a New Deodorant, Example #1 (solution) || Emergency 911!, Example #2 (solution)
Ordering a Cab, Example #3 (solution) || Traffic Accidents, Example #4 (solution)


Got to the top of the page.


Introduction || Assessment Primer || Matching Goals to CATs || CATs || Tools || Resources

Search || Who We Are || Site Map || Meet the CL-1 Team || WebMaster || Copyright || Download
College Level One (CL-1) Home || Collaborative Learning || FLAG || Learning Through Technology || NISE